The elastic stack has been the go-to solution for log monitoring since quite a while now. Storing your log data inside elasticsearch indices and querying or visualising the data in Kibana is one of the most flexible, secure, high-available and scalable solutions out there. While all of this is still valid when forwarding Kubernetes logs to the elastic stack, there are currently some limitations with the out-of-the-box solution that should be considered.
In this article we will first explore how log files should be stored resource-efficient in elasticsearch in general. We will then take a look at some of the current limitations with the default setup, as well as illustrating how to solve some of the issues by deploying es-rollover-controller in a complete demo walkthrough in Kubernetes.
Managing Time-series Indices Efficiently
There is an official blogpost from elastic, called “And the big one said ‘Rollover’”, which perfectly explains how time-based indices should be managed and stored efficiently in Elasticsearch. I highly recommend reading this article if you are interested in some of the details, as I will only be going over the main take-aways of the post.
By default, Logstash or the various Beats from elastic will ingest log data into daily Indices in Elasticsearch. While this has some advantages, for example this makes it fairly simply to cleanup old data, there are also some drawbacks. Most of the time you will have much more than only one type of index, as your applications will probably log different fields with different mappings etc. Also the amount of logs might differ greatly from one application / index to another. This will lead to having multiple indices per day, possibly one for every application you want to monitor. Also the size of these daily indices can range from some kilobytes to multiple hundreds of gigabytes.
As you might know there is a sweet-spot for the number of documents and size of a shard, depending on your cluster setup. I heard a couple of times that around 50gb per shard is a good starting point, however there are many indicators and usually taking the document count as a measure is more reliable. Managing the shard sizes efficiently has many advantages, as having a low number of shards will lead to optimal resource usage and search.
So how can this ideal shard size get accomplished? Introducing the Rollover Pattern. The rollover pattern allows for automatically creating new indices based on different rules, like the index size, document count, or age.
Let’s take a look at the elasticsearch internals, to understand exactly how all of this works: First an Index Lifecycle Management Policy has to be created, which defines the rules that trigger the creation of a new index. We can even define multiple “phases” of the lifecycle, for example a hot phase for ingestion, a warm phase for quick querying and a later cold or delete stage when the data is no longer needed. We also have to assign this ILM policy to all relevant indices via an Index Template to ensure the rules are active. Unfortunately now the current date can no longer be used for determining the active index, as we will dynamically decide when to create a new index. Therefore an alias has to be setup, which always points to the current active log ingestion index. If the specified criteria of the ILM policy are met, a new he index is created and the alias will now automatically point to the newly created index. This allows us to always ingest data to the alias and we will no longer have to worry about selecting the correct index.
So in summary we will have to setup the following artefacts to manage an index efficiently via the rollover pattern:
- ILM Policy with rules defining when an index should be rolled-over / promoted to the next lifecycle phase
- Index Template to assign the ILM policy to the relevant indices
- Creating an initial rollover index, including an Alias pointing to it, which can be used for log ingestion
As this seems like a lot of effort to setup the rollover pattern for a single index, there are of course ways to automate some of these aspects. Both the Logstash Elasticsearch output plugin, as well as the Filebeat Elasticsearch output support setting up ILM for a specified index. However there are some limitations which are worth mentioning.
Limitations of the Logstash and Filebeat ILM Automation
While both Logstash and Filebeat can setup ILM for a specified index, they do not support a dynamic setup of these policies. Usually the index name can be setup based on a dynamic variable, for example the key of a Kubernetes label. Which is a very important feature, especially in a cloud-native world where new applications are deployed hourly with different requirements.
Unfortunately the ILM setup of Filebeat and Logstash is static, as the index patterns will have to be hardcoded in the config. This has several reasons, as setting up all the required artefacts for the rollover pattern has to be reliable and the creation of these artefacts has to be ensured before starting the ingestion of data.
In large Kubernetes setups with lots of applications deployed to a single cluster, we also can not use the same index for all applications, as the logged fields and mappings will differ from application to application and the maximum number of fields or mapping conflicts can be hit easily. So how can this be solved? es-rollover-controller to the rescue!
Automatically applying the Rollover Pattern in Dynamic Environments using the es-rollover-controller
Fortunately there is a solution which automates all of this inside Kubernetes: es-rollover-controller.
The controller will watch labels of Kubernetes Pods inside a cluster and setup everything related to the rollover pattern dynamically for the Pods which have the labels attached.
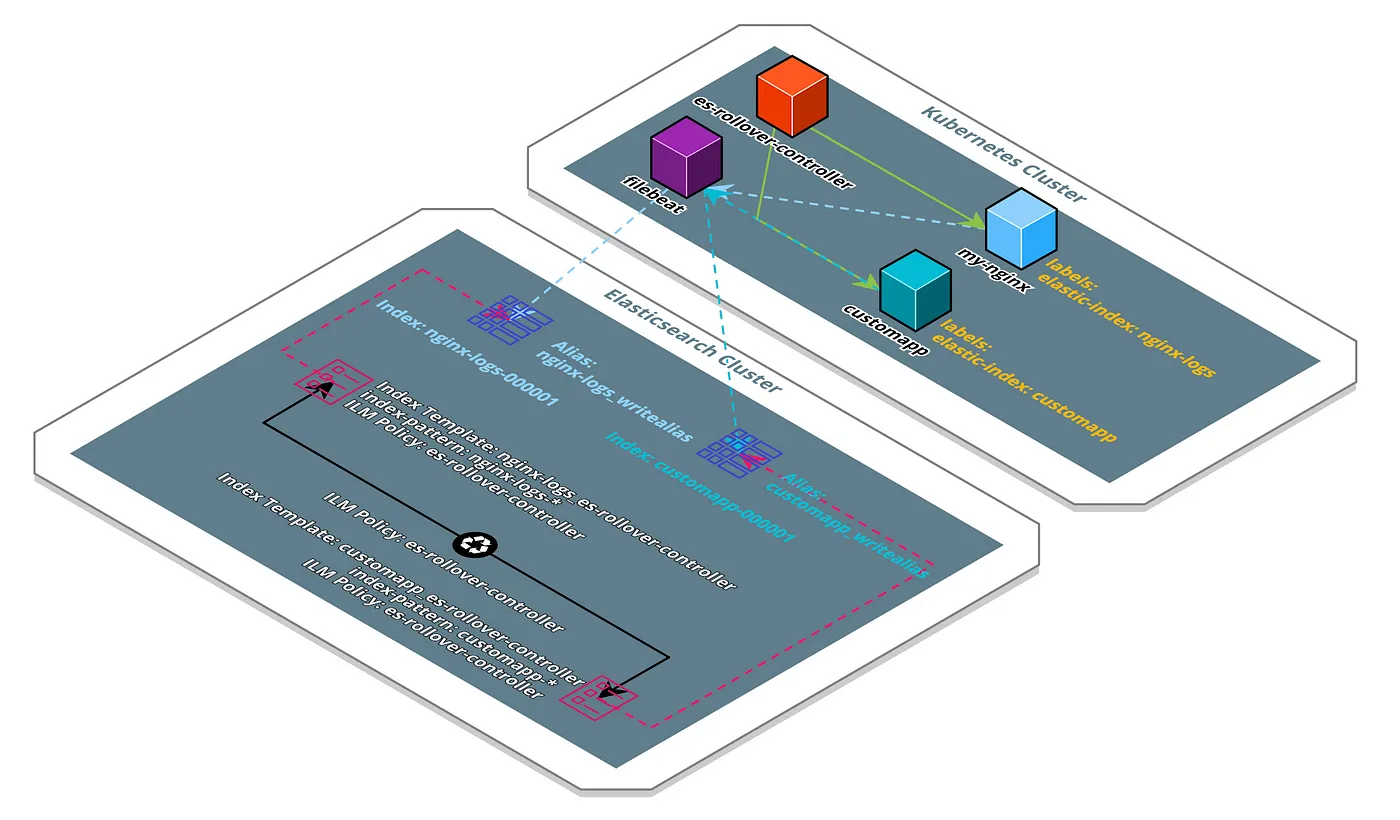
Example Scenario of the Controller Running in a Kubernetes Cluster
This example scenario illustrates how the controller works. You can see two Pods inside the cluster, which have the elastic-index label attached. The value of this label will determine the naming pattern of all the artefacts managed by the controller. In case of our NGINX Pod, the controller created the Index Template nginx-logs-es-rollover-controller, which attaches the ILM Policy es-rollover-controller to all indices created by the controller and the ILM Policy. Additionally the controller created the initial Rollover Index nginx-logs-000001 as well as the Index Alias nginx-logs_writealias pointing to the initial Index. Also this entire setup is replicated for the second Kubernetes Pod customapp. Filebeat, which is also deployed to the cluster, can now ingest logs to the matching write-alias by parsing the value of the elastic-index as well.
This shows that the controller is perfectly capable of setting up the Rollover Pattern dynamically for all different kinds of applications running inside Kubernetes.
So lets take a look at how the controller can be deployed.
Deploying es-rollover-controller to Kubernetes
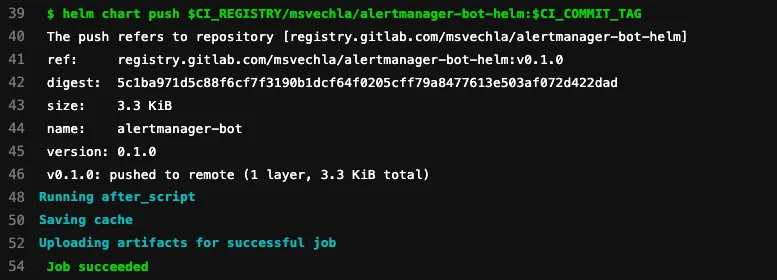
Deploying the controller to a Kubernetes cluster is as simple as running helm install. Depending on how your elasticsearch cluster is deployed though, some configuration options have to be specified.
The official Helm Chart of the controller can be found here: https://msvechla.gitlab.io/es-rollover-controller/
For this example we will assume you are running the elastic-operator / elastic cloud on kubernetes inside your cluster. You can follow the Official Elasticsearch Operator Quickstart to deploy the quickstart-es instance to the Kubernetes cluster.
After the instance is deployed, port-forward the Elasticsearch service to your local machine so we can add some custom settings:
kubectl port-forward service/quickstart-es-http 9200
PASSWORD=$(kubectl get secret quickstart-es-elastic-user -o=jsonpath='{.data.elastic}' | base64 --decode)
Now we can adjust the Cluster settings to disable automatic index creation for the write alias created by our controller:
curl -k  -u "elastic:$PASSWORD"  -XPUT "https://localhost:9200/\_cluster/settings?pretty" -H 'Content-Type: application/json' -d'
{
    "persistent": {
        "action.auto\_create\_index": "-\*\_writealias,+\*"
    }
}
'
This will prevent Filebeat from accidentally creating an index, when the controller did not yet create the matching write alias.
Next we will deploy the es-rollover-controller to the Kubernetes cluster via the provided Helm chart. Also we will override some of the default values to connect to our quickstart-es instance created in the previous step.
Lets start by adding the Helm repository of the controller to our local setup:
helm repo add es-rollover-controller [https://msvechla.gitlab.io/es-rollover-controller](https://msvechla.gitlab.io/es-rollover-controller)
As we want to configure the es-rollover-controller to connect to the quickstart-es Elasticsearch instance, we have to overwrite some of the default values of the controller. Copy the quickstart-es-values.yaml file from the controllers Gitlab repository to your local machine, which contains all necessary configuration.
For demo purposes we also want to rollover indices more quickly, this is why we also add a custom_ilm_policy.yaml, referenced in our custom values file:
kubectl apply -f custom_ilm_policy.yaml
Finally let’s delpoy the controller with our custom values:
helm install demo es-rollover-controller/es-rollover-controller -f quickstart-es-values.yaml
The controller is now deployed and watching all pods with the label elastic-index set.
Next we have to deploy Filebeat and configure it to forward all logs from pods with the elastic-index label attached to the matching write alias created by the controller.
An example all-in-one Daemonset configuration of Filebeat which achieves this can be found at filebeat.yaml in the controllers Gitlab repositoy, so let’s deploy this as well: kubectl apply -f filebeat.yaml
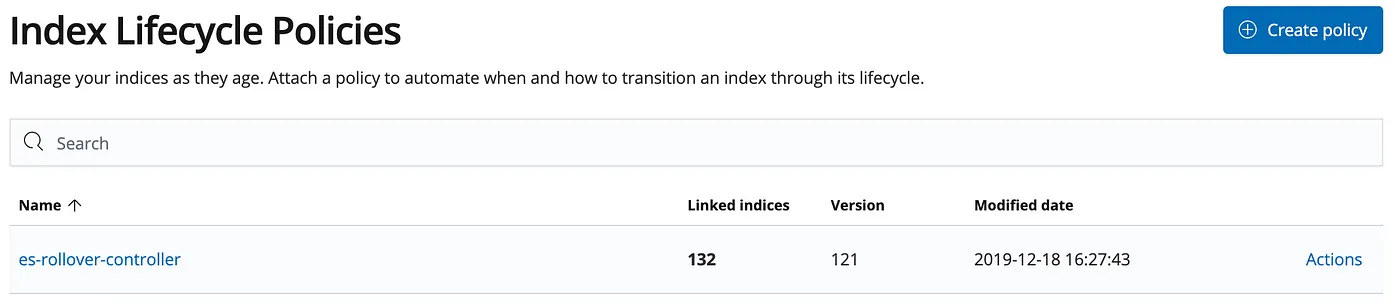
Index Lifecycle Policy Setup by the Controller as sen in Kibana
Thats it. From now on all logs from Pods that have the elastic-index label configured will get forwarded to the write-alias setup by the es-rollover-controller. If you want to deploy a Demo application that generates some random log entries, take a look at the official Quickstart Guide of the controller for an example.
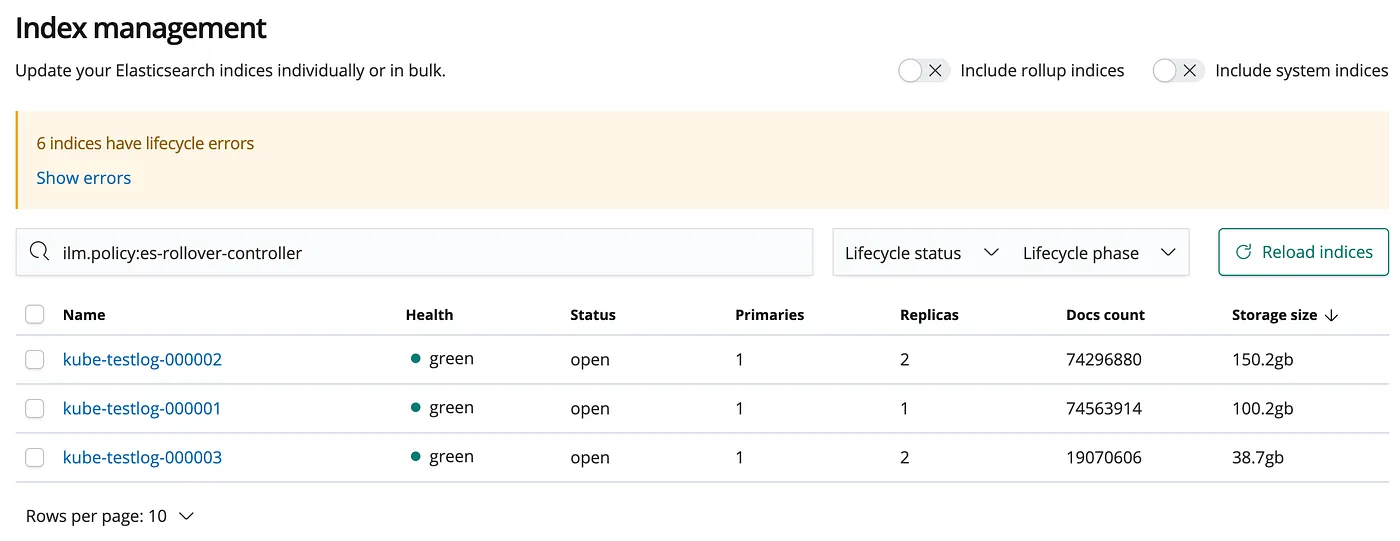
Kibana Index Management
Finally you can also review the Index Lifecycle State inside Kibana by going to the Management > Index Lifecycle Policies tab.
If you have more questions or feedback, feel free to reach out to me on Twitter or open an issue in the controllers Gitlab repository. There is a dedicated page for the controllers Helm Chart as well.